Metrics Over Opinions: Convincing a Team to Avoid Costly Mistakes
When friends pitched their crypto-social app idea, I suggested a simple MVP to test virality. Metrics showed our users weren’t sharing organically, highlighting the critical need to validate ideas before investing heavily.

A few months ago, a friend texted me asking if I knew any React Native developers. Surprised by his request, I inquired a bit more.
It turned out that he and his friend had recently attended a crypto conference, where all they heard from investors and builders was about bringing mainstream users to crypto by lowering entry barriers and enabling mass adoption.
They came up with an idea: a social app that allowed users to sign in with their socials, use Smart Wallets to simplify on-chain interactions, create their own tokens (cryptocurrencies), and share them with their friends within the app. They were ready to start hiring designers and developers, aiming to get this live within a few months.
I knew they could do things differently. Earlier that year, I had read the famous "The Lean Startup" and Giff Constable's "Talking to Humans," and since then, I had been looking for exactly this kind of opportunity. So, I offered my help in exchange for experience and equity.
The thing that worried me most about their idea was the social component and how convinced they were that this was key. So, I took that as our most important hypothesis and decided to scope down an MVP to test it out.
The MVP
After much back and forth, I convinced them not to build the entire product immediately, but instead, create a waitlist to test initial market interest.
A couple of weeks and 1k signups after launching https://www.tierraproject.io/, we were more aligned about our next steps.
By then, I had already convinced them to reduce the scope to a simpler Progressive Web App that allowed users to set up a profile and share their in-app activity on other social platforms. We were saving time and money by not developing a mobile app we weren't sure people would use.
The idea was to reward the most engaged users from our socials with tokens we'd create for marketing campaigns, hoping they'd help spread the word and attract more users by sharing posts about their rewards. These posts would appear on their feed, stating they had received a certain amount of tokens.
We designed it so the activity post would render nicely on X and Discord, directing visiting users to a page displaying the reward given. There, we included a clear call-to-action to join our waitlist, repeating the process while collecting metrics along the way.
I believed this approach would effectively test our main hypothesis: that signups could come from word-of-mouth and social media.
The Metrics
n this experiment, we had one main metric to track and two secondary metrics that, if underperforming, would significantly impact the main metric but weren't decisive alone. These were:
- Virality Coefficient (main metric)
- Sign-up rate from shared posts
- Completion rate of sharing activity
Virality Coefficient
I wanted to ensure this app had viral potential, measuring how many new users our existing users brought in.
The formula aligns with "The Lean Startup":
K (Virality Coefficient) = Number of new users / Number of users at the beginning of the experiment.
We used Posthog for app metrics and calculated the Virality Coefficient with the following HogQL query:
with referred as (
    select count(distinct id) as referred_count from persons where properties.referral is not null
),
base as (
    select count(id) as base_count from persons where properties.referral is null
)
SELECT
    ROUND((SELECT referred_count FROM referred) / (SELECT base_count FROM base), 2) as virality_coefficient
HogQL query to calculate Virality Coefficient
Here's what's happening:
- In our first MVP, we onboarded only the most engaged early adopters from the waitlist.
- Initial signups had a null referral (they joined directly).
- Converted users (waitlisted) referenced their referrer in the
referralcolumn. - Dividing the number of referred users by initial users gave us the Virality Coefficient.
However, this metric had a caveat: we didn't test if converted users themselves would post their activity, thus only examining a single referral level (immediate referrals from our first users).
This metric was critical since social apps thrive on network effects. Without network growth, alternative strategies would be necessary. Our target was at least 0.8 (just below positive virality, meaning each user brings in 0.8 new users).
Our result: 0.18, significantly below target.
Here's an image of our result:
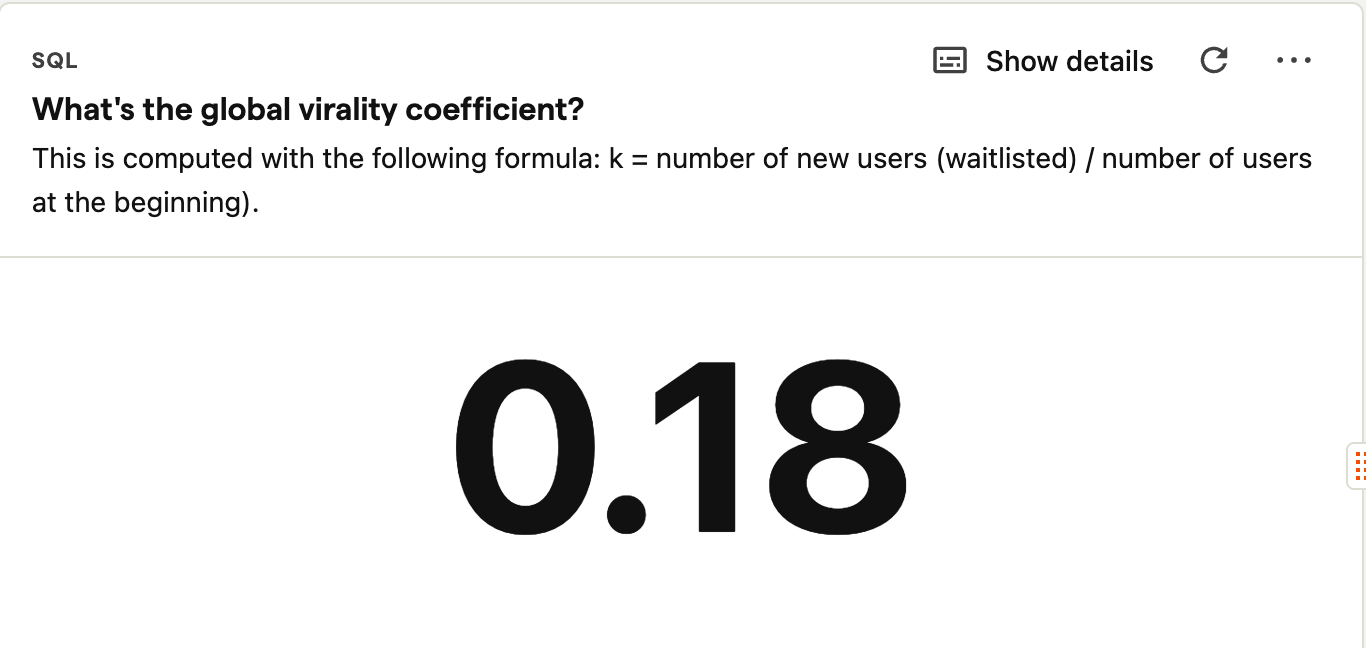
As you can see, we were quite below our targer
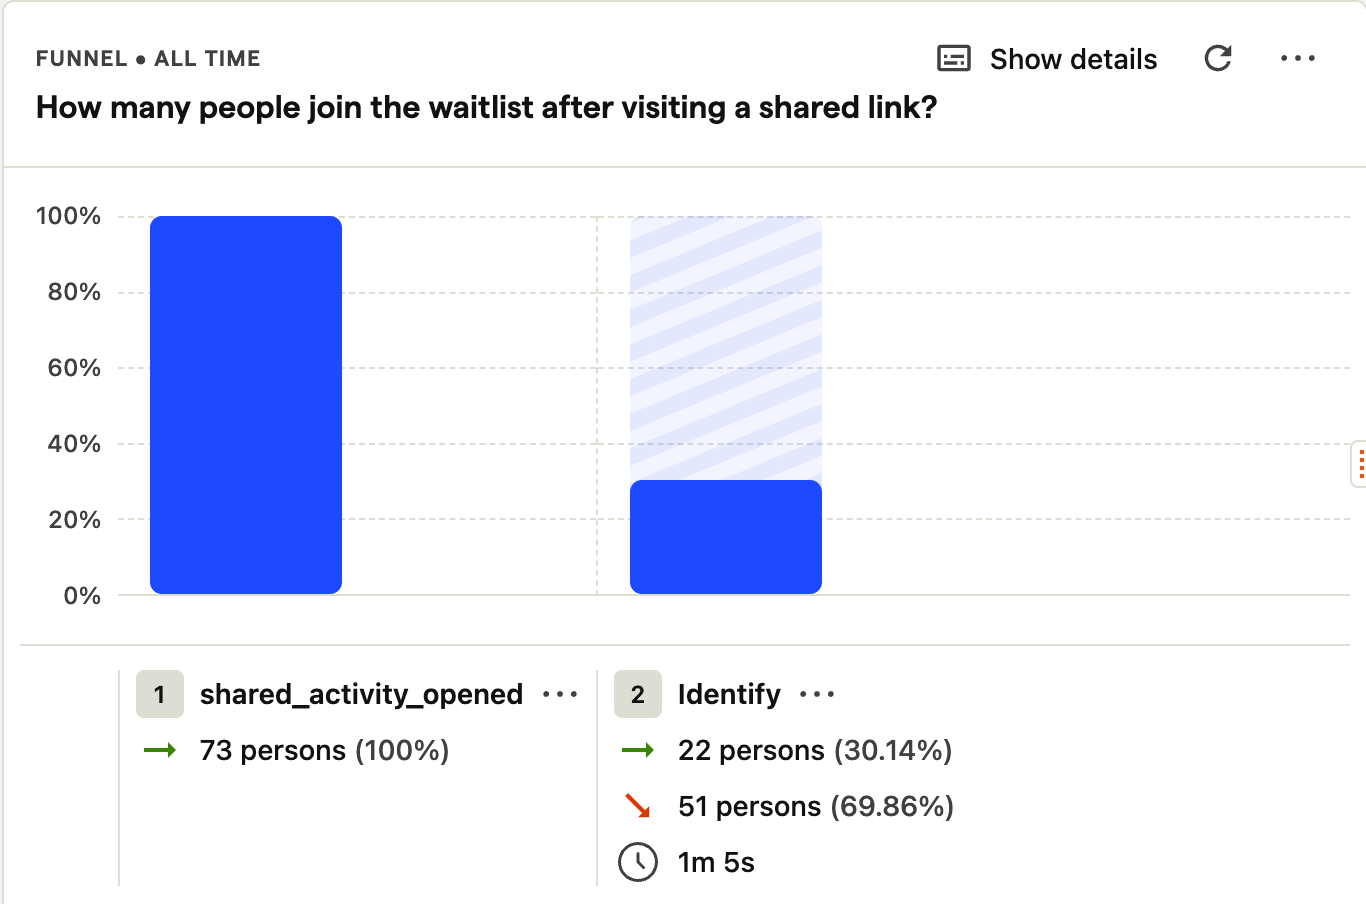
Sign-up rate (from shared posts)
Slightly related to virality, this measured how many users signed up after clicking a shared post. For example, a visitor clicking Anna's post about receiving 100 OMGCoins and subsequently joining our waitlist would increase this metric.
While not decisive alone, this helped confirm the low virality wasn't due to an exceptionally poor landing page. Our funnel tracked about a 30% conversion rate, which was within our targets.
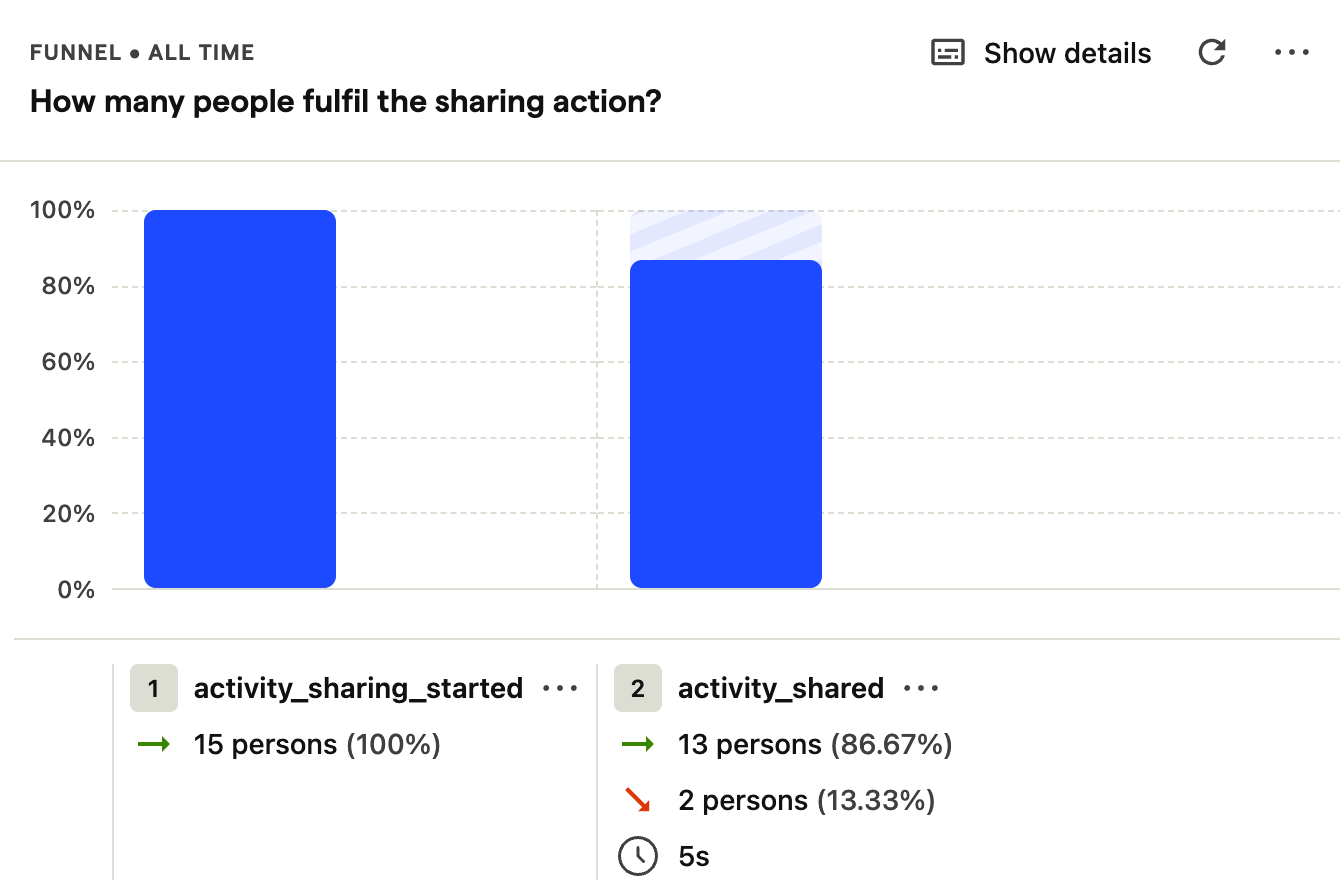
Completion Rate (of Sharing activity)
This metric clarified whether low signups resulted from users not sharing their activity or UX issues blocking them. Only 15 out of approximately 50 users completed sharing their activity, lower than expected.
This raised the question of whether users genuinely had (or needed) an incentive to share their posts. If so, what did that imply for us?
The funnel looked like this:
The Outcome and learnings
Given these results, especially the low Completion Rate and Virality Coefficient, it became evident we needed either to iterate significantly or pivot to something less dependent on virality (which we ultimately did).
I also learned how challenging it is to shift people's perspectives on product building. Even after convincing my friends to reduce scope and focus on metric-driven decisions, I had to regularly dissuade them from expanding the MVP.
People are naturally proud of their ideas, making it difficult to counteract their desire to build the product they envision. I should have been stricter about allowing scope creep.
Considering the time invested, scope extensions, and discouraging metrics, we pivoted to another approach, which is content for another post.
Conclusion
Tracking metrics is excellent for guiding investment decisions, but it's insufficient on its own. Unless stakeholders deeply appreciate the need for market validation before building, convincing them to ship minimal products remains challenging.
Metrics could have further guided us had we continued iterating, but our low volume limited their significance. If we'd allowed users to directly join the app instead of the waitlist, we might've learned more before pivoting.
Overall, this was a fun and insightful experience. It allowed me to experiment beyond my regular job, providing a sense of working on something genuinely meaningful.
At the same time, it completely felt like a bet on something that could do big. Thinking in retrospect I was living an asymmetric life before I had even learned about what it was.